Date
Data is not perfect. We all know that. A little while ago I stumbled onto an Annotated Honey Bee Images dataset from Kaggle and decided to map it, except I couldn’t map it right away. The dataset included text for the city names where the images were collected, but not the latitude and longitude coordinates needed to map the locations. I decided to do some geocoding to get the coordinates for each location to map the bees!
What is geocoding?
Geocoding is the process of converting addresses/places into geographic coordinates which can be used to place markers on a map. For example, by geocoding “Squamish, British Columbia, Canada” you can say that “Squamish” can be found at (49.701634, -123.155812) latitude and longitude coordinates. You can geocode addresses, cities, dog parks, countries, pretty much any place you can think of!
What geocoding tools are available?
One option, maybe the most obvious one, is the Google Maps API. To be able to access this API, you need to create an account on the Google Cloud Platform and get an API key. Google provides detailed instructions on how to do that.
Another option is to use Nominatim, a public API from OpenStreetMap. OpenStreetMap is an open-source collaborative project aimed to create free map services for the public. Nominatim does not require you to register and get an API key. It does have its limits if you want to use it extensively in an application. You will need to provide an email account to identify your application, limit your requests to a single machine and thread, and no more than 1 request per second; OSM servers have limits after all.
Why geocode with R?
Geocoding and mapping data with R instead of a web or GIS application brings the general advantages of using a programming language in analyzing and visualizing data. With R, you can write the code once and use it over and over, while also providing a record of all your steps in the creation of a map. The R community has created a few packages, which can be used for accessing the Google Map and Nominatim APIs. Let’s have a look at them.
Using ggmap with the Google Map API to Geocode
ggmap is a package for R, which enables the creation of maps with ggplot. You will first need to register your Google API key using the register_google() function from the ggmap package. To geocode the locations of a dataset, use the mutate_geocode() function. mutate_geocode() requires a data frame with a column containing the locations to geocode. The goal is to get a data frame with all the distinct locations and geocode them. We then join our original data frame with the geocoded data frame of distinct locations and just like that, every observations in your main dataset will have latitude and longitude coordinates which can be mapped.
Example
Register your Google Map API Key:
register_google(key = <GoogleAPIKey>)
Get a data frame of distinct locations:
library(ggmap)
library(dplyr)

# sample data
bee_data <- data.frame(location = c("Alvin, TX, USA", "Alvin, TX, USA",
                                    "Saratoga, CA, USA",
                                    "Athens, GA, USA", "Athens, GA, USA", "Athens, GA, USA",
                                    "San Jose, CA, USA", "New Orleans, LA, USA",
                                    "Des Moines, IA, USA", "Keene, NH, USA",
                                    "Keene, NH, USA"))
# get the distinct locations from the dataset and create a data frame
locations_txt <- distinct(bee_data, location)
locations_txt <- as.data.frame(locations_txt)
head(locations_txt)
#>               location
#> 1       Alvin, TX, USA
#> 2    Saratoga, CA, USA
#> 3      Athens, GA, USA
#> 4    San Jose, CA, USA
#> 5 New Orleans, LA, USA
#> 6  Des Moines, IA, USA
The first argument in mutate_geocode() is the data frame of distinct locations. The second argument is the column containing the location names. mutate_geocode() returns a geocoded data frame of locations.
locations_geo <- mutate_geocode(locations_txt, location)
head(locations_geo)
#>               location           lon        lat
#> 1       Alvin, TX, USA     -95.24410   29.42385
#> 2    Saratoga, CA, USA    -122.02301   37.26383
#> 3      Athens, GA, USA     -83.35757   33.95193
#> 4    San Jose, CA, USA    -121.88633   37.33821
#> 5 New Orleans, LA, USA     -90.07153   29.95107
#> 6  Des Moines, IA, USA     -93.62496   41.58684
Join the geocoded data frame with the original data frame:
bee_data_joined <- left_join(bee_data, locations_geo, by = "location")
bee_data_joined[1,]
#>               location           lon        lat
#> 1       Alvin, TX, USA     -95.24410   29.42385
Using tmaptools package and the Nominatim API to geocode
tmaptools is a package for R, which enables the reading and processing of spatial data. Many of the tmaptools functions rely on the Nominatim API. Nominatim is free and open-source and there is no need for an API key.
The workflow for using tmaptools to geocode is similar to the ggmap workflow. To geocode the locations of a dataset use the geocode_OSM() function. Let’s use tmaptools to get the same coordinate information we extracted using ggmap.
Example
The first argument in geocode_OSM() is the data frame column containing the text locations. We set details to FALSE because we are only interested in the coordinates, and we set as.data.frame to TRUE in order to get a data frame back.
library(tmaptools)

nominatim_loc_geo <- geocode_OSM(locations_txt$location,
                              details = FALSE, as.data.frame = TRUE)
You will notice that geocode_OSM() returns a data frame containing latitude, longitude, and a minimum and maximum range for both coordinates.
# display first row
nominatim_loc_geo[1,]
#>                query           lon         lat         lat_min         lat_max         lon_min         lon_max
#> 1      Alvin, TX, USA     29.42385   -95.24410        29.06809        29.50237       -95.58356       -95.05651
We are interested in the lat and lon columns for each observation. Drop the min and max columns and rename the query column before joining.
nominatim_loc_geo <- nominatim_loc_geo %>%
  select(query, lat, lon) %>%
  rename(location = query)
Join the geocoded data frame with the original data set.
bee_data_joined <- left_join(bee_data, nominatim_loc_geo, by = "location")
bee_data_joined[1,]
#>               location           lon        lat
#> 1       Alvin, TX, USA     -95.24410   29.42385
Every location in the bee_data_joined data fame has been geocoded.
Image
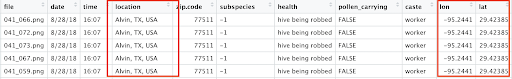
First rows of bee_data_joined
Conclusion
We have successfully geocoded the locations where the bee observations where taken.
We have covered:
- how to use the ggmap package with the Google Map API to perform geocoding.
- how to use the tmaptools package with the Nominatim API to perform geocoding.
You can now map your geolocated observations using your favorite mapping package!
Image
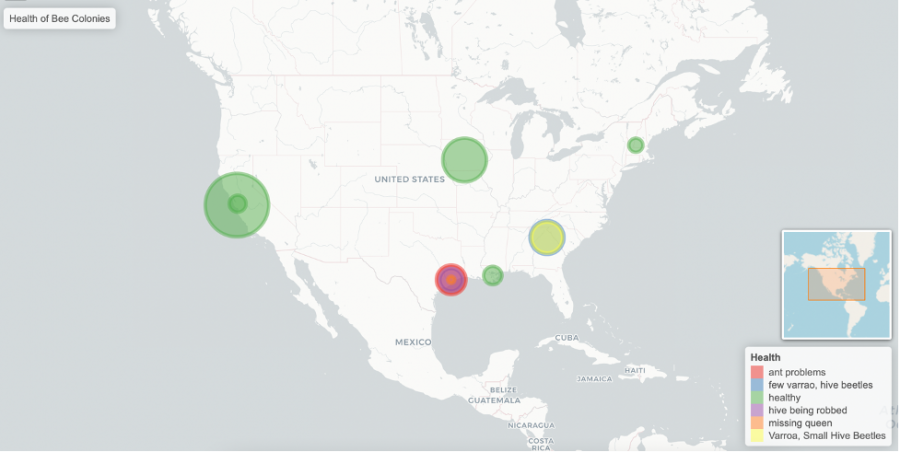
Be aware that the quality of the data and its completeness might vary among different service providers.
Share