
Date
Overview
A downloadable version of this lesson is available here:
Document
Image

Calvet-Mir et al., 2015.
Complex systems are all around us. Whether we are talking about economic, ecological, or social systems, they all comprise multiple components connected by interactions that vary in strength and direction. Viewed this way, network diagrams and the science of network analysis are very useful tools for understanding complex systems and how they function. Will more connections result in a system that is overall more stable, i.e., more likely to recover from some disruption? Will loss of one or more components from the system render it overall less robust, i.e., more likely to completely collapse? These are the types of questions that ecologists and social scientists have long asked about the respective systems they study. More recently, environmental scientists from many domains (ecology, hydrology, physical geographers, etc.) have joined forces with social scientists (sociologists, anthropologists, archeologists, etc.) to study linked human and natural systems, i.e., socio-environmental systems. In this Part 2 of the 3-part lesson on networks, we use social systems to introduce basic network concepts and then use a published study to illustrate the use of these concepts. The study focuses on the role of influential households in patterns of resource sharing among subsistence Alaskans.
Assumed Prior Knowledge
Appropriate for undergraduates and above.
Learning Objectives
- Understand a few key terms used to describe networks and how measures of network structure can reflect emergent properties of networks.
- Gain knowledge on how network analyses contribute to understanding social systems, particularly as they relate to environmental problems.
- Practice using network analyses to understand patterns of social interactions using a study by anthropologists focused on resource sharing by subsistence households in Alaska.
Key Terms/Concepts
social networks; actors; socio-environmental networks; subsistence harvests; network centrality; node degree; closeness centrality; betweenness centrality; resilience; advanced learners: Gini coefficients; Shannon index; ERGM statistics
The “Hook” (suggestions for quickly engaging students)
Image

Personal Social Networks. Have participants bring out their smartphones or laptops and open the social media app of their choice, e.g., Instagram, Twitter, TikTok. Have them review their personal social network in the app, given the following: each person, including themselves, is a “node;” each person they follow is an outgoing “link;” each person that is following them is an incoming “link.” Ask them to sketch out a diagram to show a subset of the nodes and the links to/from those nodes and consider the questions below. (Note to instructor: Ask participants to keep their diagrams to themselves; social media comparison can have negative psychological consequences.)
- How many nodes are in their social network?
- Are there clusters of groups or interests?
- Do the frequency of links between them and some of the other nodes vary? (Ones most frequently interacted with should have thicker arrows).
- Are there some nodes they can only follow (outgoing link but no incoming link) and some reciprocal nodes (i.e., both inward and outward arrows)?
Teaching Assignments
This lesson is for a 50 min session. Prior to the session, ask the participants to complete the following:
Undergraduates: Watch the video tutorial (35 min.) by Jen Golbeck, called, “Network Basics” and read and take notes on the highlighted sections of the 2021 article by Scaggs et al. (link below).
Graduate Students and Above: Read the article by Tabassum et al. 2018. Social network analysis: An overview. Wiley Interdisciplinary Reviews: Data Mining and Knowledge Discovery, 8(5), page e1256 and read the whole 2021 article by Scaggs et al.
Document
Scaggs et al. 2021.pdf
(2.36 MB)
-
Centrality Network Analysis in Social Systems
Using the following image (which is also in slide 2 of the linked PowerPoint below), ask the participants to guess which actor (node) in this diagram has the most influence in the network.
Image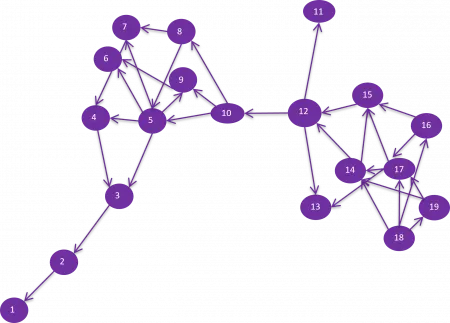 Document
Using PowerPoint slides 3-7 and their animations, ask the participants to respond to each prompt. Note there are instructions and additional information for instructors in the “notes” section of each slide.
- Slide 3 prompts: Why are network metrics useful? How would you describe an actor’s influence using a network diagram?
- Slide 4 prompt: How are each of these three centrality metrics calculated? What do they reflect in terms of their meaning?
- Slides 5, 6, 7: Use these slides to ask participants to indicate which actor (node) they think corresponds to the respective metric? Click on the animation to show the answer.
-
Applying Network Analysis to Understand Alaskan Food Sharing Networks
Ask the participants to pull out their notes from reading the Scaggs et al. paper. Let them know that while the authors used exponential random graph models (ERGM) in their analyses, the participants need not understand the details of ERGMs but simply that they are a class of statistical methods for building and analyzing social (and other) networks. Share Slide 8 with participants and ask them to save it with their name for editing (it is Figure 2 from the Scaggs paper). Ask the participants to split into groups, discuss the following (jotting down responses), and complete the tasks.
Questions for Undergraduate Students:
- In what way does the social network diagram help you understand strategies that households use for subsistence?
- What is a super-household and why are they important network-wide? What is the ecological counterpart of a super-household? (Answer: keystone species).
- On the image in the shared slide 8, highlight several nodes that your group believes are super-nodes. How do the positions of super-households in the network differ from other households?
- Why is diversity of harvested resources important to the food networks of this community?
- Focusing on node degree, how does this social network reveal inequalities?
- Using a different color than earlier, highlight several nodes in the image from shared slide 8 that your group believes may be the most resilient in the face of resource fluctuations.
- By looking at the diagram, can you discern any relationship between harvest diversity and household productivity?
- Table 4 in the paper provides data on what types of foods households harvest vs share—why do you think there are such differences in what is shared vs. harvested?
Questions for Graduate Students and Above:
- How can managers use information that is illustrated in these network diagrams to set policies (e.g., limits on catches)?
- Explain Gini Coefficients and how Figure 1 in Scaggs et al. illustrates inequality.
- Why is Shannon’s index a preferred way to measure harvest diversity (i.e., as opposed to just the total number of species harvested)?
- The authors tested hypotheses related to the effects of household harvest diversity, productivity, and reciprocity (each is considered a covariate in their statistical models) on patterns in the social sharing network, i.e., they asked, how do the covariates influence network properties such as the number of sender transfer links?
- Based on their quantitative analysis (use of ERGM statistics), what did the authors find in terms of the relationship between harvest diversity, productivity, and network properties? How might this relate to the resilience of these communities?
- How did their network analysis provide clues to socio-cultural norms (i.e., related to ethnicity or gender)?
Background Information for the Instructor
-
Network Structure
The network lecture by Jen Golbeck on YouTube follows her “Network Basics” video that was assigned. It provides an overview of analytics (use of metrics) to describe properties of networks that are commonly used including: node degree, network density, node centrality (closeness, degree, betweenness, Eigenvector, connectivity, and cohesion).
Golbeck, Jen. (2013). Network Structure [Video]. YouTube. https://www.youtube.com/watch?v=89mxOdwPfxA
-
Reconciling Conflict and Cooperation in Environmental Governance: A Social Network Perspective
This conceptual paper summarizes the use of Social Network Analysis (SNA) to understand the roles of cooperation and conflict in environmental management. They navigate socio-ecological networks to assess the challenges to integrating network models that represent cooperation and conflict.
Bodin, O., García, M.M., & Robins, G. (2020). Reconciling Conflict and Cooperation in Environmental Governance: A Social Network Perspective. Annual Review of Environment and Resources, 45, 471-491. https://doi.org/10.1146/annurev-environ-011020-064352
Share