Date
Description
Image

A downloadable version of this explainer is available here:
The Next Generation of Quantitative Analytics
With advances in artificial intelligence (AI) analytics and the rise of big data created by high volumes of social media posts, critical discourse analysis (CDA) researchers have new quantitative, locational, and demographic tools at their disposal. Software like T-LAB enables text mining that reveals meaningful patterns of words and themes in large datasets. Such software can scan large stores of discourse to identify frequency of terms and thematic trends, and it can conduct comparative analyses across documents.
The open source software Gephi generates visuals of social networks within socio-environmental (S-E) systems. It helps researchers explore data through network dynamics including nodes’ connectivity, centrality, and closeness.
Social media data from apps like Instagram and Flickr allow researchers to mine vast quantities of users’ experiences that include information on demographics, location, time, and keywords, which can create thematic threads. Together, these data approaches represent the evolution of discourse analysis into the quantitative realm. By harnessing software’s quantitative analytical power, researchers may enjoy new qualitative insights about complex S-E interactions.
Multipronged Research of S-E Systems
Researchers may use Artificial Intelligence (AI), Social Network (SN), and Social Media (SM) analyses independently or in tandem, depending on their datasets and analytical needs. For example, Vigl et al. (2021) made innovative use of AI and SM analytics to identify hot spots of cultural ecosystem services (CES) based on their aesthetic value and proximity to population centers. They examined an AI-based approach for inferring aesthetic landscape values by users of the social media app Flickr. AI’s computer vision and text mining allowed them to draw links between photographers' preferences in capturing landscapes and a set of CES (aesthetic value, outdoor recreation, cultural heritage, and symbolic species). Combining keywords from ~640,000 artificially generated tags of photographs taken in the Italian Dolomites (a UNESCO World Heritage Site), with geographic information data demonstrated that aesthetic preferences can be linked to various natural and human variables that spatially predict CES valuation patterns. They found that people highly appreciated the Dolomites in Italy for aesthetic value (66% of images), cultural heritage (13%), outdoor recreation opportunities (11%), and symbolic species (10%). Hotspots of CES’ benefits occurred in areas with high environmental tourism that are close to residential areas, which provide critical infrastructure for the tourist industry. Figure 1 (below) is a useful visualization of their SM tagging process:
Image
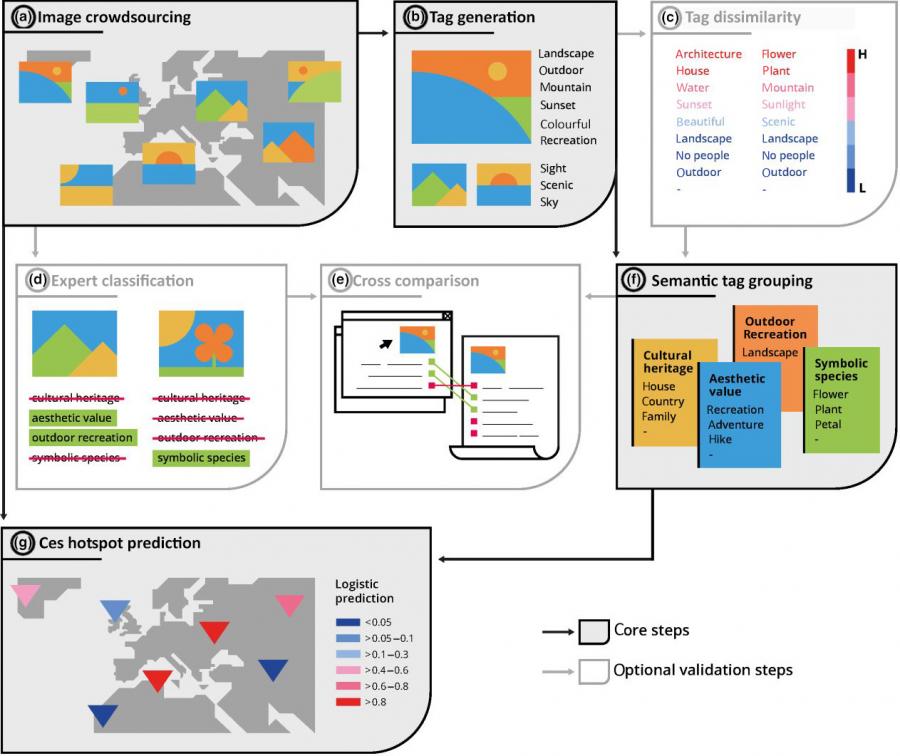
In innovating CDA by combining AI with SM data, the researchers were able to model a method that supports rapid and transferrable CES assessments across the globe. This work is essential in providing environmental planners with quantitative measures of various CES markers within specific natural areas. This work is in support of a mandate to identify and protect the most prolific locales for CES.
Social Network analysis helps researchers create visuals that reveal links and dependencies among S-E system components. For example, Urbinatti et al. (2020) made use of SN to conduct a systematic literature review (SLR) of the Food-Energy-Water (FEW) governance nexus. They identified themes, networks, and gaps across a SLR of 28 key papers. Their SN research used Gephi to create visuals that grouped actors in nodes and made links between nodes based on common ground, such as financial exchanges, friendships, and mutual dislikes. In tandem, they used CDA to develop quantitative analytical techniques including word repetitions and lexical patterns to identify themes among FEW nexus governance regimes. Using T-LAB software for text-mining and machine learning algorithms, they achieved a quantitative dataset that allowed them to create SN visuals, and they conducted a qualitative assessment of critical discourse linkages in FEW nexus governance. See Figure 2 below:
Image
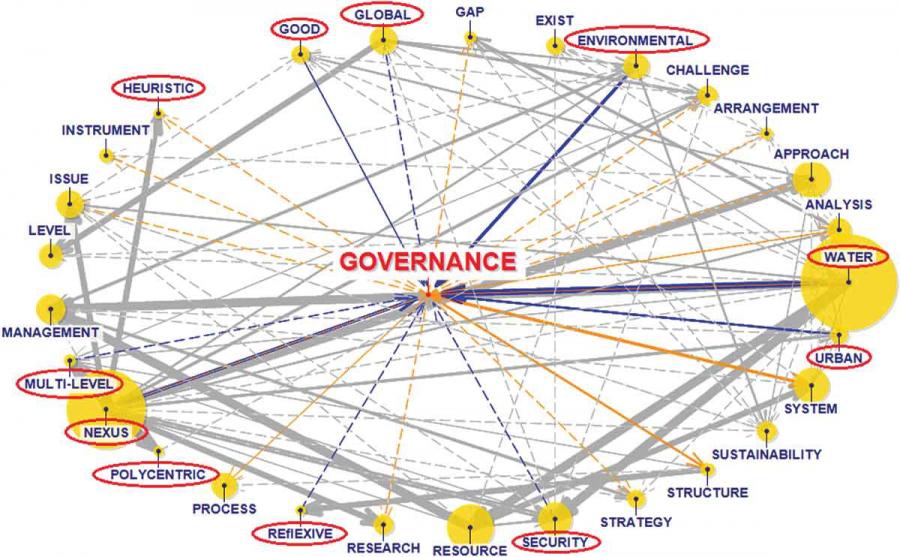
This ego network analysis (called an “ego” network because it stems from a single node) highlighted concepts related to “governance,” chiefly the 11 terms circled in red that show high degrees of network connectivity. The authors’ SLR concluded by identifying 24 governance-related concepts within 8 larger conceptual groupings. In combining SLR, SN, and CDA methods, the authors achieved a new organization of governance patterns that allowed them to focus on integrated governance across sectors. This discernment of nexus patterns informed their pursuit of a synthetic approach guided by intersectionality, interactionality, and hybridity—complex states not easily elucidated by a singular analysis. Their hybrid approach was crucial to reducing complex and vast datasets to intelligible visuals that they could readily use with the public to share new insights that synthesized discourse in writing, visuals, and SM activity.
Critical Discourse Analysis: Conclusions
This series of five explainers on CDA has followed the rich interdisciplinary history of how we may find deeper meaning and significance beneath the surface level of discourse. Thus far, we have:
- Navigated denotation, connotation, and myth in word choice and context
- Analyzed the discourses of scientific writing and journalism to identify themes, biases, and erasures
- Discerned aesthetics, pathos, and positionality in the use of visuals like photos and scientific charts
- Enabling powerful quantitative analysis using software that scans and organizes discursive patterns in research publications and social media:
S-E researchers have a bevy of tools at their disposal. In deploying these approaches, S-E researchers may seek novel collaborations among humanists, social and natural scientists, and software engineers. They may discover research avenues opened by big data software to revitalize archival, demographic, and ecological datasets that may not have been approachable with earlier analytical tools.
References
Urbinatti, A.M., Benites-Lazaro, L.L., de Carvalho, C.M. et al. (2020). The conceptual basis of water-energy-food nexus governance: systematic literature review using network and discourse analysis. Journal of Integrative Environmental Sciences, 17(2), 21-43. https://doi.org/10.1080/1943815X.2020.1749086
Vigl, L.E., Marsoner, T., Giombini, V. et al. (2021). Harnessing artificial intelligence technology and social media data to support Cultural Ecosystem Service assessments. People and Nature, 3(3):673–685. https://doi.org/10.1002/pan3.10199
Share